Results of the Excel Pivot Table survey
Last updated on March 19, 2012 By Victor Chan
A couple of weeks ago we ran a Pivot Table Survey for people interested in learning about Pivot Tables for data analysis. Thanks to everyone who took part.
To encourage more responses to the Pivot Table survey there was a contest for our favorite response to the first 2 questions in the survey:
Question 1: What are your top questions about Pivot Tables that we absolutely MUST answer in this course?Question 2: What would it mean to you if you could have your top questions on Pivot Tables answered?
Read on to find out who won prizes and discover the results of the survey.
Winners of Pivot Table Contest

Well done to Andrew from Marlton, New Jersey who sent in this winning entry:
I am pretty comfortable using pivot tables now, but I like a lot of people had a problem initially, trying to understand what a pivot table could do that plain old excel couldnt. I think that an example of why it is useful would help lots of people.
Also, using an example that lots of people can relate to is very important. Some people don’t use excel for finance or sales and others don’t use it for collecting data. A professor with a list of students, hometowns, grades etc. may be a good example.
[If I could have my top questions on Pivot Tables answered]… it would mean a lot. – Andrew
We asked Andrew to tell us a little about himself – he uses Excel mostly for business purposes in the aerospace / defense industry but finds it very useful at home as well. Andrew was awarded a $25 Amazon Gift Card for his contribution.
We also gave a $25 Amazon Gift Card to Brian from Atlanta, Georgia. Brian was chosen as the second winner by using an Excel spreadsheet to select one entry from all entrants at random.
So – congratulations Andrew and Brian. And thank you to everyone who took part.
Pivot Table Survey Findings Summary
Let’s have a quick look at what we found from the survey.
First thing to mention is that the number of responses was hardly breath-taking, with a grand total of 14 people responding to the survey.
I’ll be the first to admit that we shouldn’t draw too many conclusions based on such a small sample of Excel users.
Nevertheless some patterns did emerge.
Charting the appeal of different course formats
We asked respondents to pick their preferred training course format. Each respondent marked their interest on a scale of 1 to 5 (1 being Not interested, 5 being Very interested). There were 8 different formats to choose from.
1. E-book download to computer (PDF format)
2. E-book download to Amazon Kindle
3. E-book download to Apple iBooks
4. Video course download to computer
5. Video course on DVD
6. Live public coaching webinar
7. Private consulting or coaching sessions
8. Online members-only site (videos & articles)
The most favored formats for a Pivot Table training course were:
1. E-book download to computer (PDF format) 72% interested or very interested
2. Video course download to computer 64% interested or very interested
Naturally I created some Excel charts to show the distribution of survey responses. Here they are:

1. E-book download to computer (PDF format)
43% of respondents were very interested
29% of respondents were quite interested
14% of respondents did not indicate a response
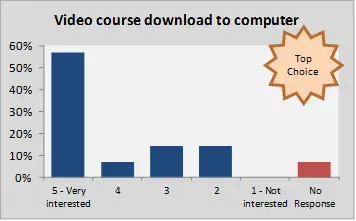
2. Video course download to computer
57% of respondents were very interested
7% of respondents were quite interested
7% of respondents did not indicate a response
Other Responses

As you can see from the above charts, there was moderate interest in Live Public Coaching Webinars and a Video course on DVD. There was comparatively little interest in e-book formats for the Kindle and Apple iBooks.
How to Create Professional Business Charts
If you are interested in creating your own Professional Business Charts I would recommend you check out Charley Kyd’s Business Charts Swipe File. They might inspire you to create eye-catching professional-quality Excel charts.

Designed by Charley Kyd at www.exceluser.com
33 downloadable Business Charts and Tables that are professionally created for Word, PowerPoint and Excel
Each download comes with 2 sets of documentation (“Getting Started” and “About the figure”)
Available for all versions of Excel (PC or Mac) from Excel 97 to Excel 2010
You choose which ones you want to download – or you can download them all!
And if you want to take charting a step further into Excel Dashboard Reports, take a look at Charley Kyd’s Excel Dashboard Templates. They are updated dynamically due to being linked with formulas to an Excel database that you set up, and can be set up in minutes.
Other interesting observations from the Survey
The most popular price points for a Pivot Table training course were:
$20-$29 (38.5% of respondents)
$30-$49 (23.1% of respondents)
The most common areas where Pivot Table skills would be used were:
Business Analysis (76.9% of respondents)
Financial Analysis (53.8% of respondents)
Sales Analysis (46.2% of respondents)
Most respondents indicated they would use Excel 2010 (61.5%) or Excel 2007 (46.2%).
Pivot Table Training Course – coming soon
Armed with a better understanding of the Pivot Table training course market, we’ll start work on a Pivot Table course. If all goes well you will be able to get the course in mid to late 2012.
And if you’ve got any more feedback please feel free to leave a comment below.
Cheers!
Victor
Related Posts:


Hi, I'm Victor!
Are you struggling with complex Excel tasks? Feeling overwhelmed by spreadsheets that are hard to use?
Many people believe mastering Excel is about learning shortcuts, functions, and formulas. But this overlooks the importance of building practical, real-world applications. It's not just about knowing the tools. It's about using them effectively.
That's where I come in. You'll get a unique perspective to Excel training from me. I have over 20 years of experience at Deloitte and two global tech companies. And I know what can make a difference in your career.
Let me help you integrate Excel into your professional life. Starting today. Read one of my articles, watch one of my videos. Then apply the new technique to your work. You'll see the difference immediately!
Recommended Posts


Discover the PROVEN Blueprint for transforming your Excel skills, supercharging your productivity, and standing out in your career! My course helps you to learn Excel VBA and save hours of time even if you have zero prior experience with programming.

Solve tricky Excel problems and take your work to the next level! Get customized solutions for your unique needs. Save time and gain insights with truly expert Excel solutions from only $97 per task.

Get a clear overview of your project progress using the Excel project timeline. Use it to communicate the big picture, track task progress, and stay on top of your project goals. Stay organized with our project timeline!

Our cheat sheets provide quick and easy reference to commonly used Excel VBA concepts and code snippets.
Unlock new levels of productivity and efficiency with our cheat sheets, and write VBA code like a pro in no time.
RECOMMENDED READING

Are you looking to upskill and stay ahead of the curve? Excel is a powerful tool that keeps growing in demand. We round up the best online courses for learning Excel.

Are you looking to up your spreadsheet game? Excel is an invaluable tool that can help you stay organized and save time. From data analysis to budgets, Excel can do it all!

Today, having Excel skills is more critical than ever. Those who know how to use Excel are more likely to find higher-paying jobs. And get promoted faster.
JOIN FREE EMAIL NEWSLETTER
Step up your Excel game! Join our free email newsletter and get updates on how to become more awesome at Excel.
© 2011-2025 Launch Excel